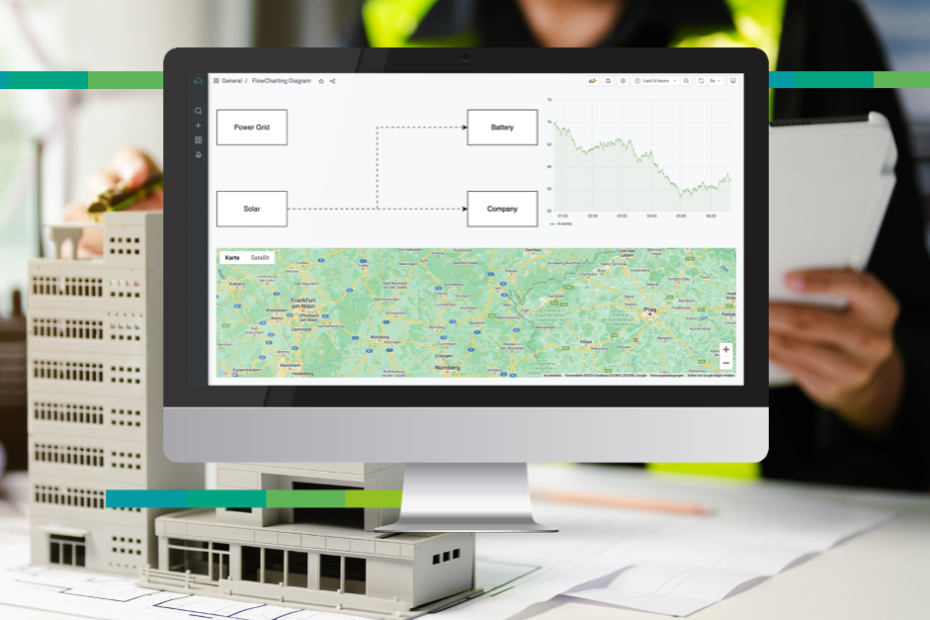
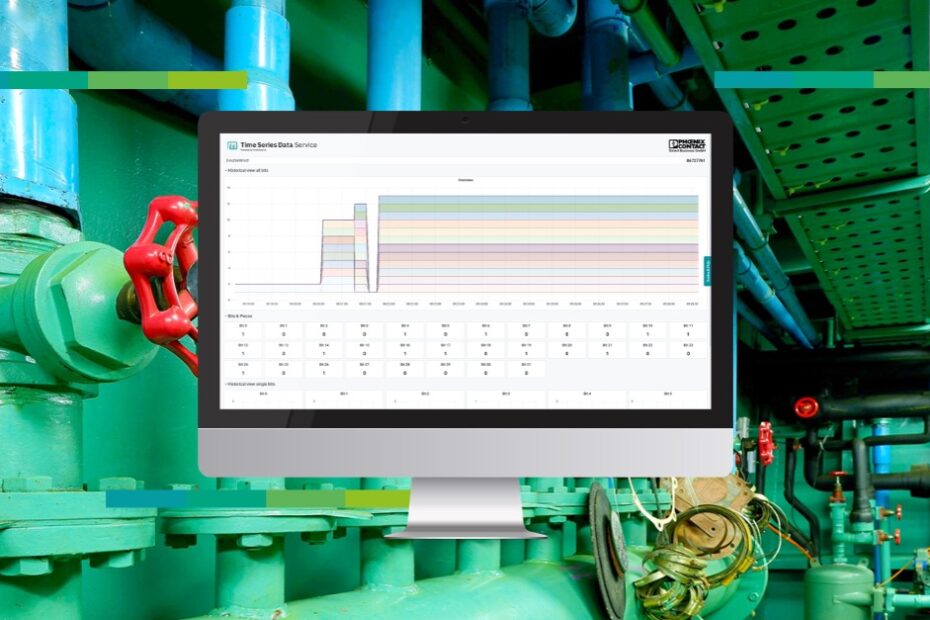
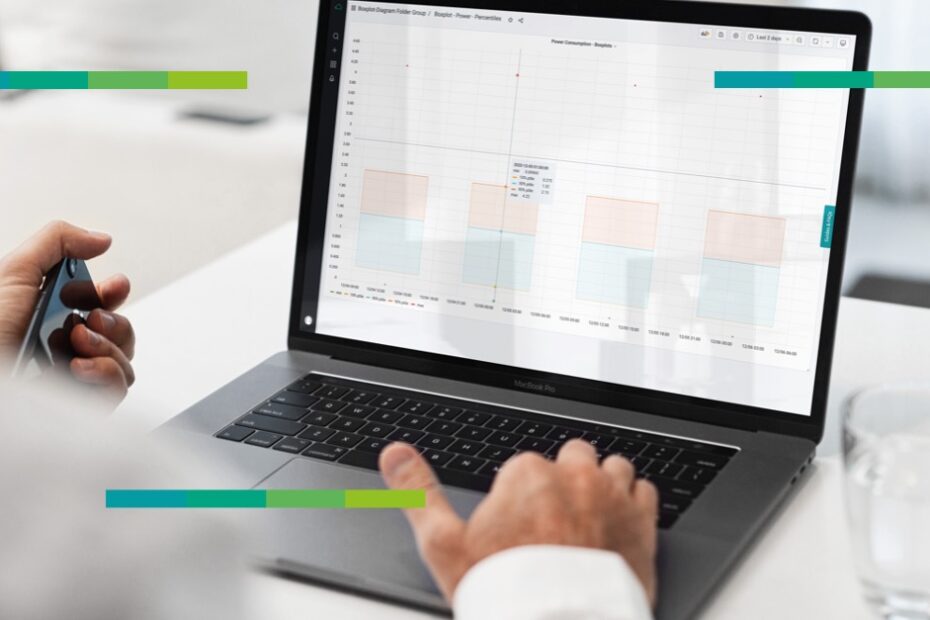
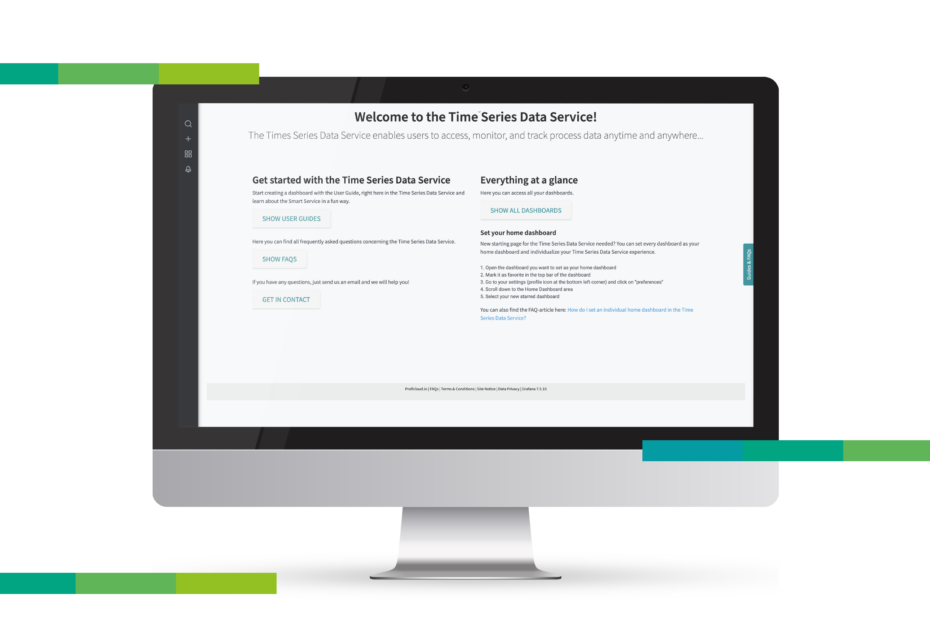
New visualization in the Time Series Data Service: The FlowCharting Diagram
Experience the new FlowCharting function in the Time Series Data Service. Create interactive flowcharts, visualise production cycles and devices, and animate them with KPIs. Make complex issues easy to understand and share knowledge throughout your organization. Try it out today!


