EMMA Service
Use the EMMA Service to get a quick overview of the energy consumption depending on e.g. produced units and find out with subsequent analysis what is most likely to influence your energy consumption.
- Create meaningful dashboards, specialized for energy management
- Create graphs that give you information about your current energy consumption
- Create EnPi reports and download them so you can share them with your customers and colleagues
- Make use of an integrated alerting system and get to know, when you use too much energy
Contact us so that together we can realize your requirements.
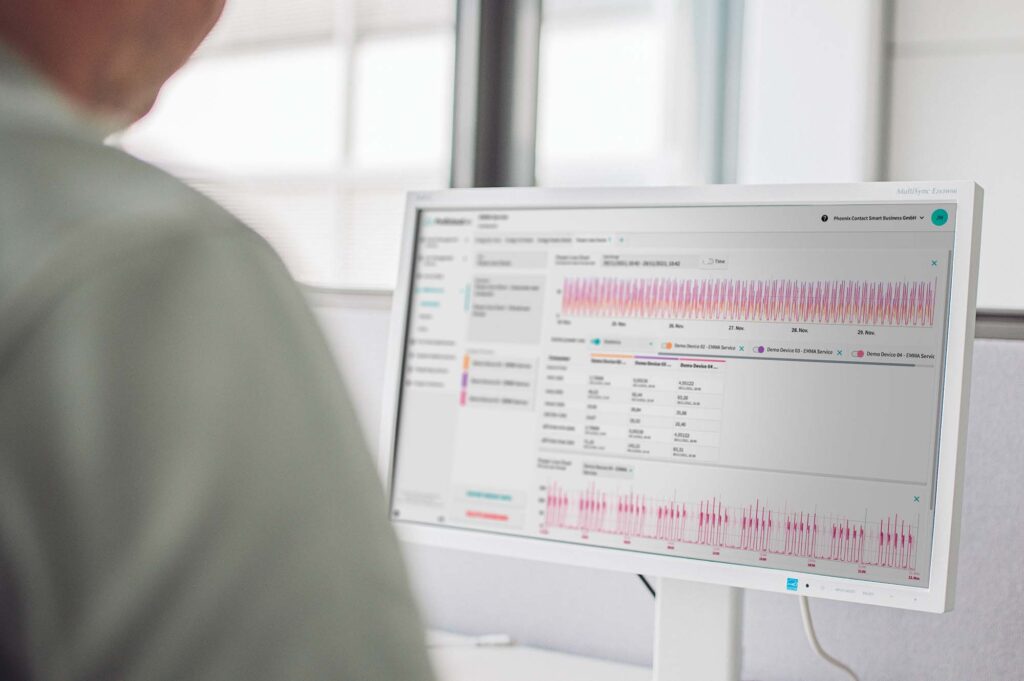
Energy Monitoring, Management, Analytics: Smart energy management – anytime, anywhere
Energy Monitoring, Management, Analytics: The Smart Service EMMA and the IoT-enabled EMpro energy measuring devices are the pioneers for your energy management of the future.
Take advantage of the cloud and benefit from many intuitive and flexible features to monitor, analyze, and evaluate your energy and performance data – anytime, anywhere. A range of easy-to-understand dashboards simplifies energy management. Thanks to the EMMA Service, you can make faster, better decisions and streamline workflows through remote monitoring. This saves time and money.
Get transparency about how much energy a production line consumes in order to reduce production to avoid load peaks
With the EMMA Service you can analyze exactly how much energy a device measures – accordingly you can react when you notice that a certain limit is exceeded.
In addition to the general display in easy-to-read dashboards, the EMMA Service also offers the option of notifying you as soon as a limit value is exceeded. This allows you to optimize or reduce processes and productions in a timely manner so that you do not have to pay the high costs for exceeding your energy usage.
Get knowledge about how much energy you have to use for one, two, ten or thousands pieces
With Proficloud.io and the EMMA Service you have the possibility to get overviews of produced units and compare them with other time periods if necessary.
EMMA Service reports allow you to create day-by-day, week-by-week, and month-by-month reports that you can enrich with units produced, so that EMMA Service tells you exactly how much energy was consumed per unit. These reports can be easily downloaded and sent to colleagues.
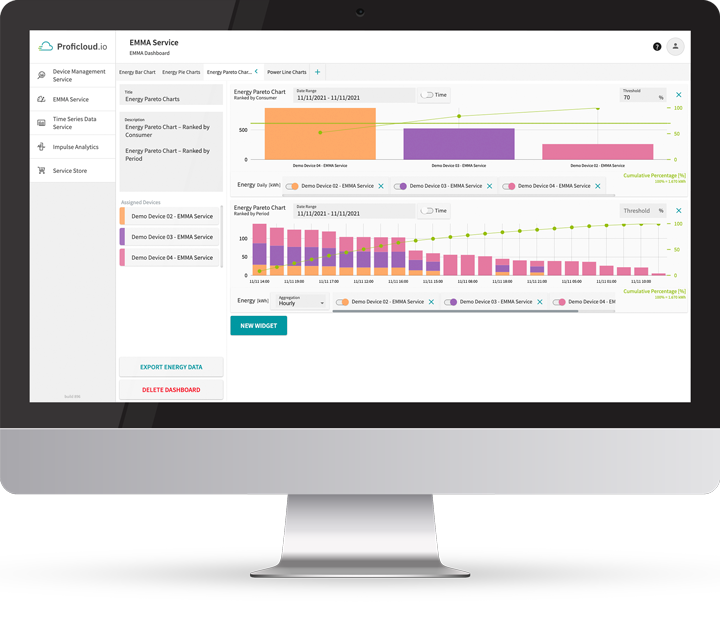
Understand which production line, plant or machine uses the most energy
Use the capabilities of multiple dashboards and prepare your energy data in a way that is easy to understand and use.
Create comparison dashboards in the EMMA Service with different devices in one widget to easily and effectively compare this data. With additional statistics available, you can dive even deeper into the comparison to identify optimization potential.
EMMA Service description
Use external data sources for your analysis
Use the possibility in the EMMA Service to include data from external sources (currently as a CSV file) in your display in order to be able to compare historical data (before using Proficloud.io) with current data, for example. You can rely on the ease of use and create “virtual devices” in the EMMA Service, which you can use again at any time (e.g. in further reports/dashboards).
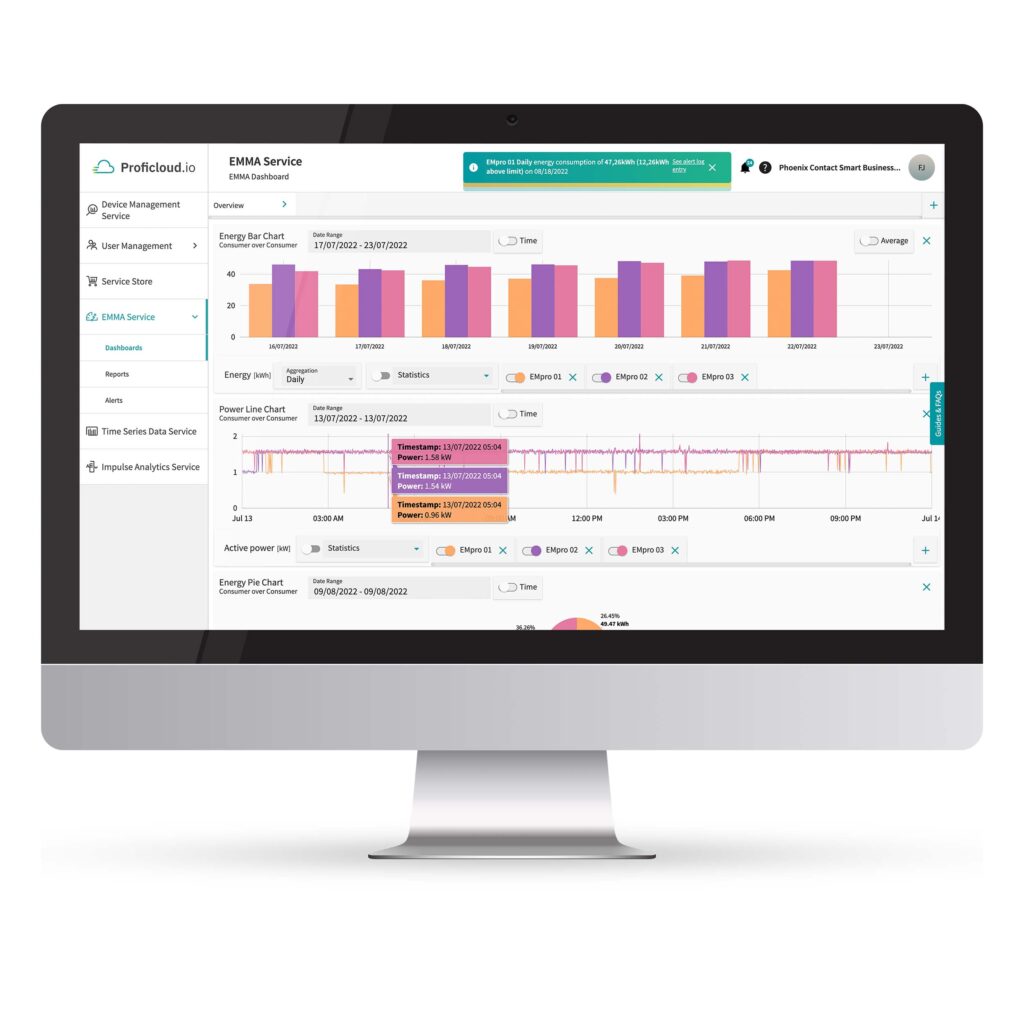
Easy to use dashboards and widgets
With just a few clicks, you can draw initial conclusions about your processes and energy consumption. Use the different visualization options such as Energy Pie Charts, Energy Bar Charts, Power Line Charts, Pareto Charts and more.
Use these charts to compare individual production lines, equipment or time periods and uncover hidden potential.
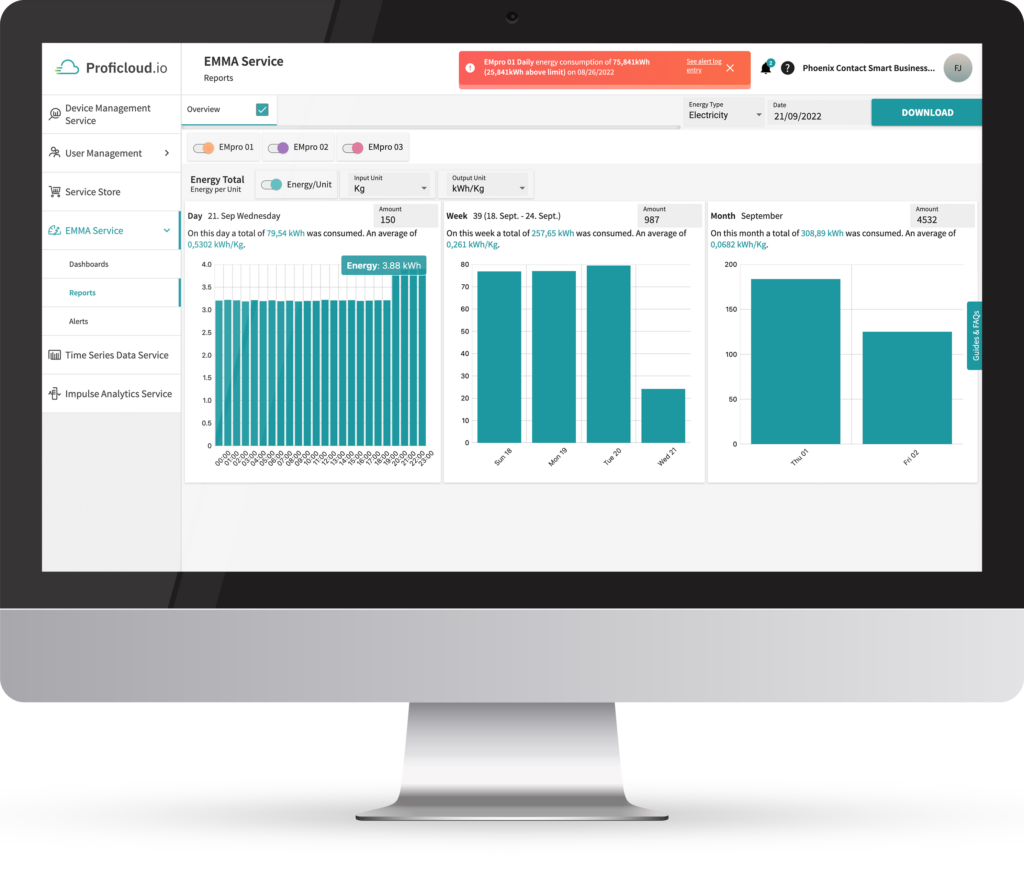
Based on your dashboards, create simple reports with EnPIs
With the report function of the EMMA Service you have the possibility to create reports that give you information about your Energy Performance Indicators (EnPI). In the reports you have the possibility to add or remove individual devices or measuring stations – customize the Smart Service exactly to your needs. Once customized, you can compare days, weeks and months.
With the handy download function, you can easily download the created reports as PDFs and send them to your colleagues via email, for example – without them needing separate access to Proficloud.io.
Use the alert rules to be notified
Use the alerts of the EMMA Service to be informed Proficloud.io-wide about limit over- or underruns. Create alerts in just a few clicks with the intuitive wizard and get an overview of peak consumption. You can create different alerts with different priorities, so that the system alerts you at an early stage of a limit violation.
In the Alert Log, you can view the alerts that have been triggered and, if necessary, go into detail when you click on an alert.

Schedule live demo for the EMMA Service
Would you like to see the functions live? With pleasure! We will be happy to show you all the functions directly in live operation, make an appointment today!
Want to see the whole offer? That’s for sure possible as well! Just mention this in the mail and we will work things out.

Pricing
Show the EMMA Service in the Service Store for pricing, compatibility and changelogs.
The EMMA Service is a paid Smart Service on Proficloud.io. Licenses can be booked in the Service Store for individual devices. These are valid for one year and are automatically renewed.
Further information


Hi, my name is Hendrik Schramm and I am glad to help you out!
Please do not hesitate to contact me. Also, if you have any suggestions or comments, just send us a message to inbox[at]phoenixcontact-sb.io and we will answer as soon as possible.