Energy Monitoring, Management, Analytics: The EMMA Service and the Phoenix Contact IoT-capable EMpro energy measuring devices are the companions for your energy management of the future. Go straight into the IoT with EMpro technology and benefit from cloud-based data acquisition and intuitive, flexible functions for targeted, meaningful visualization.
With a user-friendly web-based user interface, the EMpro energy meter can be configured in 6 simple steps and integrated into the IIoT platform Proficloud.io and the EMMA Service. Reduce the time required to implement a energy management system.
Integration in 6 easy steps
- Configuration of a cloud connection via the integrated web server in the EMpro energy meter (Phoenix Contact hardware)
- Creation of a free account on Proficloud.io
- Adding the hardware in Device Management Service
- Booking an EMMA Service Subscription via the Service Store
- Adding the included hardware to the EMMA Service subscription
- Creation of dashboards using widgets
More about the Device Management Service

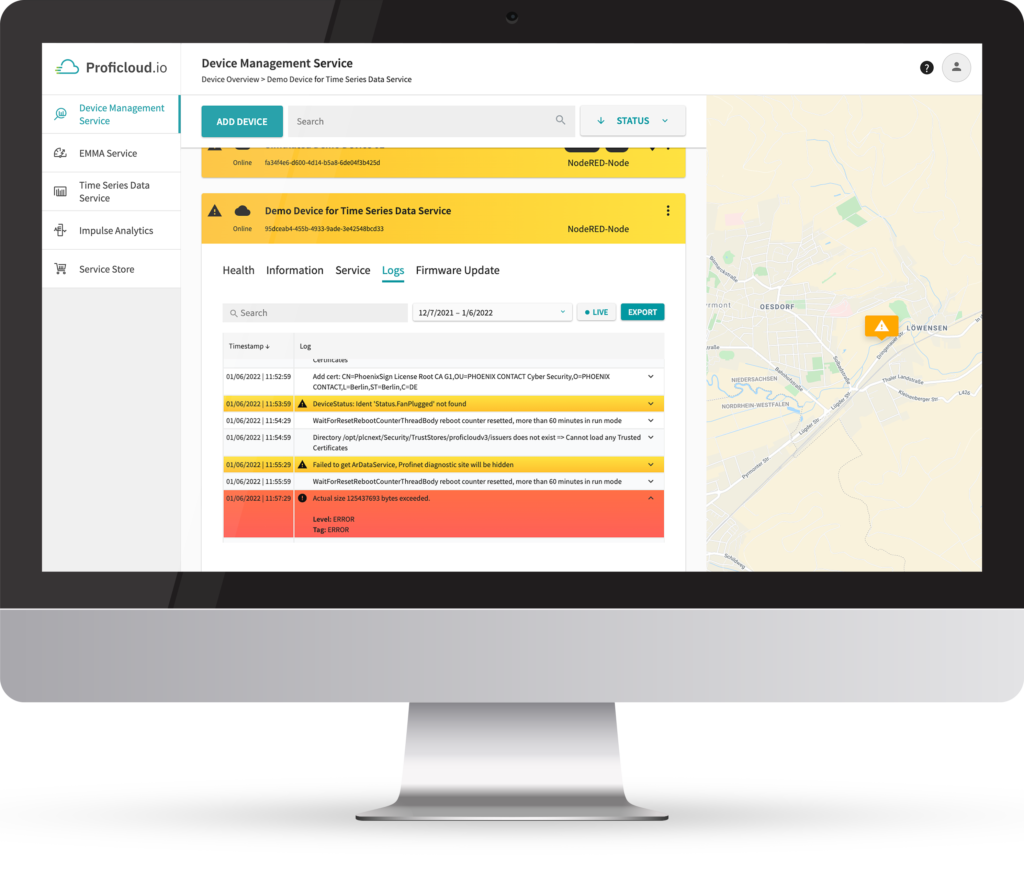
Manage and monitor your cloud-enabled energy meters and other smart devices from Phoenix Contact with the Device Management Service. You get a direct overview of device information as a digital nameplate, such as device type, serial number and installed firmware and hardware version.
They also keep an eye on their health status. The so-called TrafficLight shows directly whether there is a warning or an error in the device. Device logs can be accessed for more detailed information.
Regular firmware updates are essential to ensure device security. A direct update function from the service is available for this purpose.
More about the EMMA Service

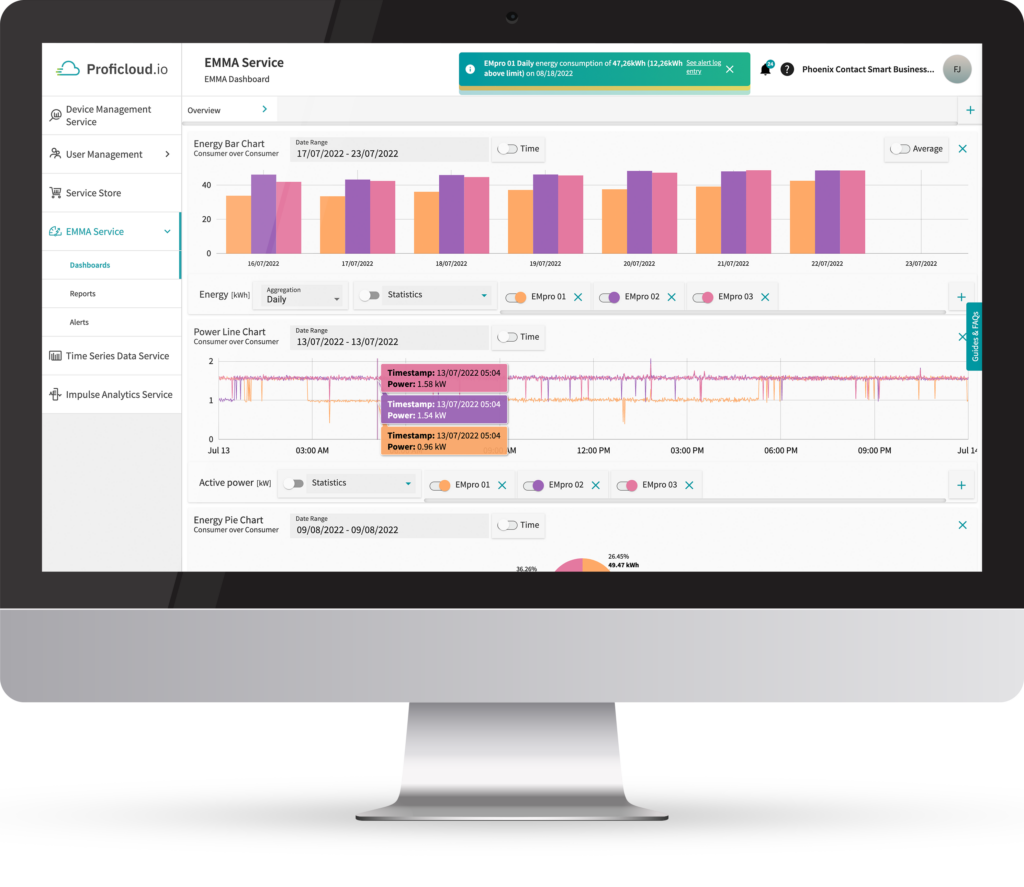
Take advantage of the cloud and benefit from many intuitive and flexible features to monitor, analyze, and evaluate your energy and performance data – anytime, anywhere. A range of easy-to-understand dashboards simplifies energy management. Thanks to the EMMA Service, you can make faster, better decisions and streamline workflows through remote monitoring. This saves time and money.
User-friendly dashboards and widgets
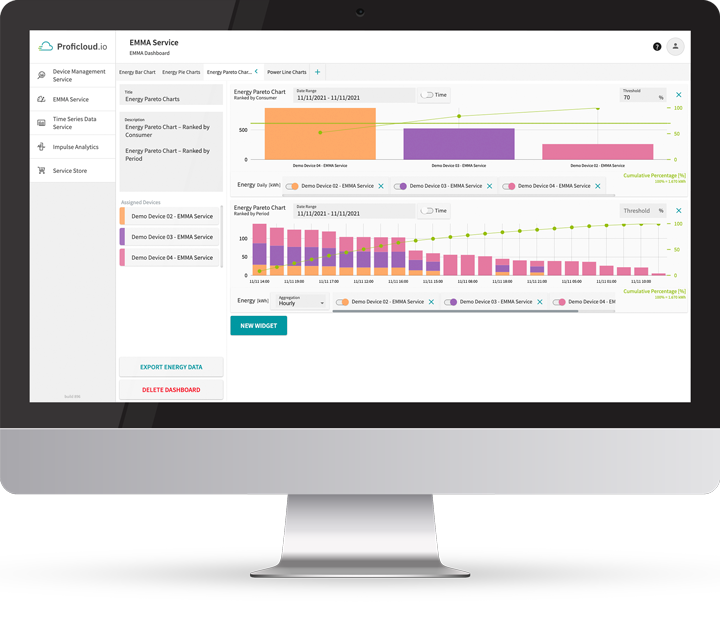
With just a few clicks you can draw initial conclusions about your data and your energy consumption. Build dashboards according to your needs and use the variety of visualization options such as pie, bar, line charts and more.
Use these widgets to compare individual production lines, systems or time periods and uncover potential savings.
Features of the EMMA Service at a glance
- Integration of external data sources possible for further data transparency
- Export of data for further processing in other systems can be easily exported
- Warning about upcoming limit overruns or underruns directly in the Smart Service
- Visualization of key energy figures (Energy Performance Indicator – EnPI) are displayed with the reporting feature


