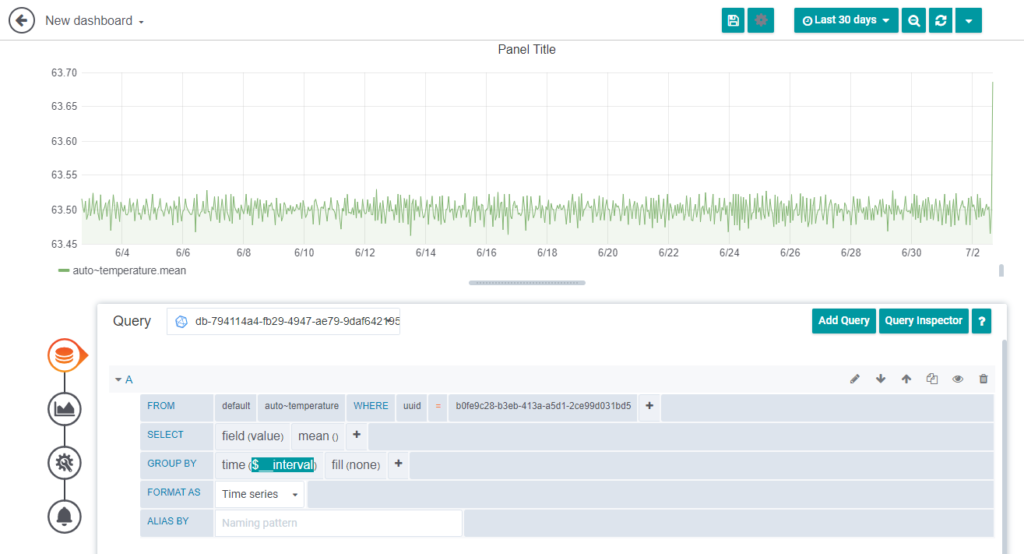
Our cloud system delivers data to your browser where the data is rendered and displayed. We limit the maximum number of data points for each query to 20000 points. Please note, that querying more data points for a single query is not providing much information, because your screen resolution likely does not have the resolution to display all of the data anyway. The limitation keeps processing time in the browser in check and results in a more snappy response of the user side.
If you want to view a larger time range, where you would end up with more than 20000 data points, we recommend you have a look at the grouping and aggregation parameters for the queries. Our template dashboards do this by default. You can choose a grouping interval to suit your needs, but it usually suffices to use the “$__interval” range. This will take the selected time range, your screen resolution and size of the panel into account and our database will aggregate the data for you. You can choose different aggregation options through the query editor. The benefit of this is, that the load is shifted to our cloud system and the amount of data which must be transferred to your browser is reduced. This also results in much smaller workload for your browser resulting in a better user experience. Have a look at the following screenshot for an example:


